A responsibility of the National Highway Traffic Safety Administration (NHTSA) is to write and enforce federal regulations concerning motor vehicle safety. Under the New Car Assessment Program, the safety of a new vehicle is evaluated by analyzing data collected from a series of crash tests. One of the tests performed is the 35-mph frontal barrier impact test, whereby a vehicle is propelled such that it crashes head-on at 35 mph into a rigid barrier that spans the width of the vehicle; the video footage in Figure 1 shows a 2016 Honda CR-V undergoing this type of test.
Figure 1. Real-time footage of a 2016 Honda CR-V undergoing a 35-mph frontal barrier impact test (NHTSA test no. 9492). The source video, which is freely available through NHTSA, may be downloaded from here.
The test dummies (a driver and typically at least one passenger), the vehicle, and the impact barrier are highly instrumented to measure, for example, acceleration and loads; the corotational components of angular velocity experienced by the dummies’ heads are sometimes measured. These acceleration and angular velocity data may then be used to numerically simulate the motion of the dummies’ heads during the crash.
Contents
Equations of motion
Consider the crash test dummy head shown in Figure 2. We shall parameterize the rotation of the head using a 3-2-1 set of Euler angles  ,
,  , and
, and  that relate the space-fixed basis
  to the head’s corotational basis
  , where the basis vectors
 and
and  are oriented such that they are consistent with the Society of Automotive Engineers’ standard for dummy coordinate systems [1].
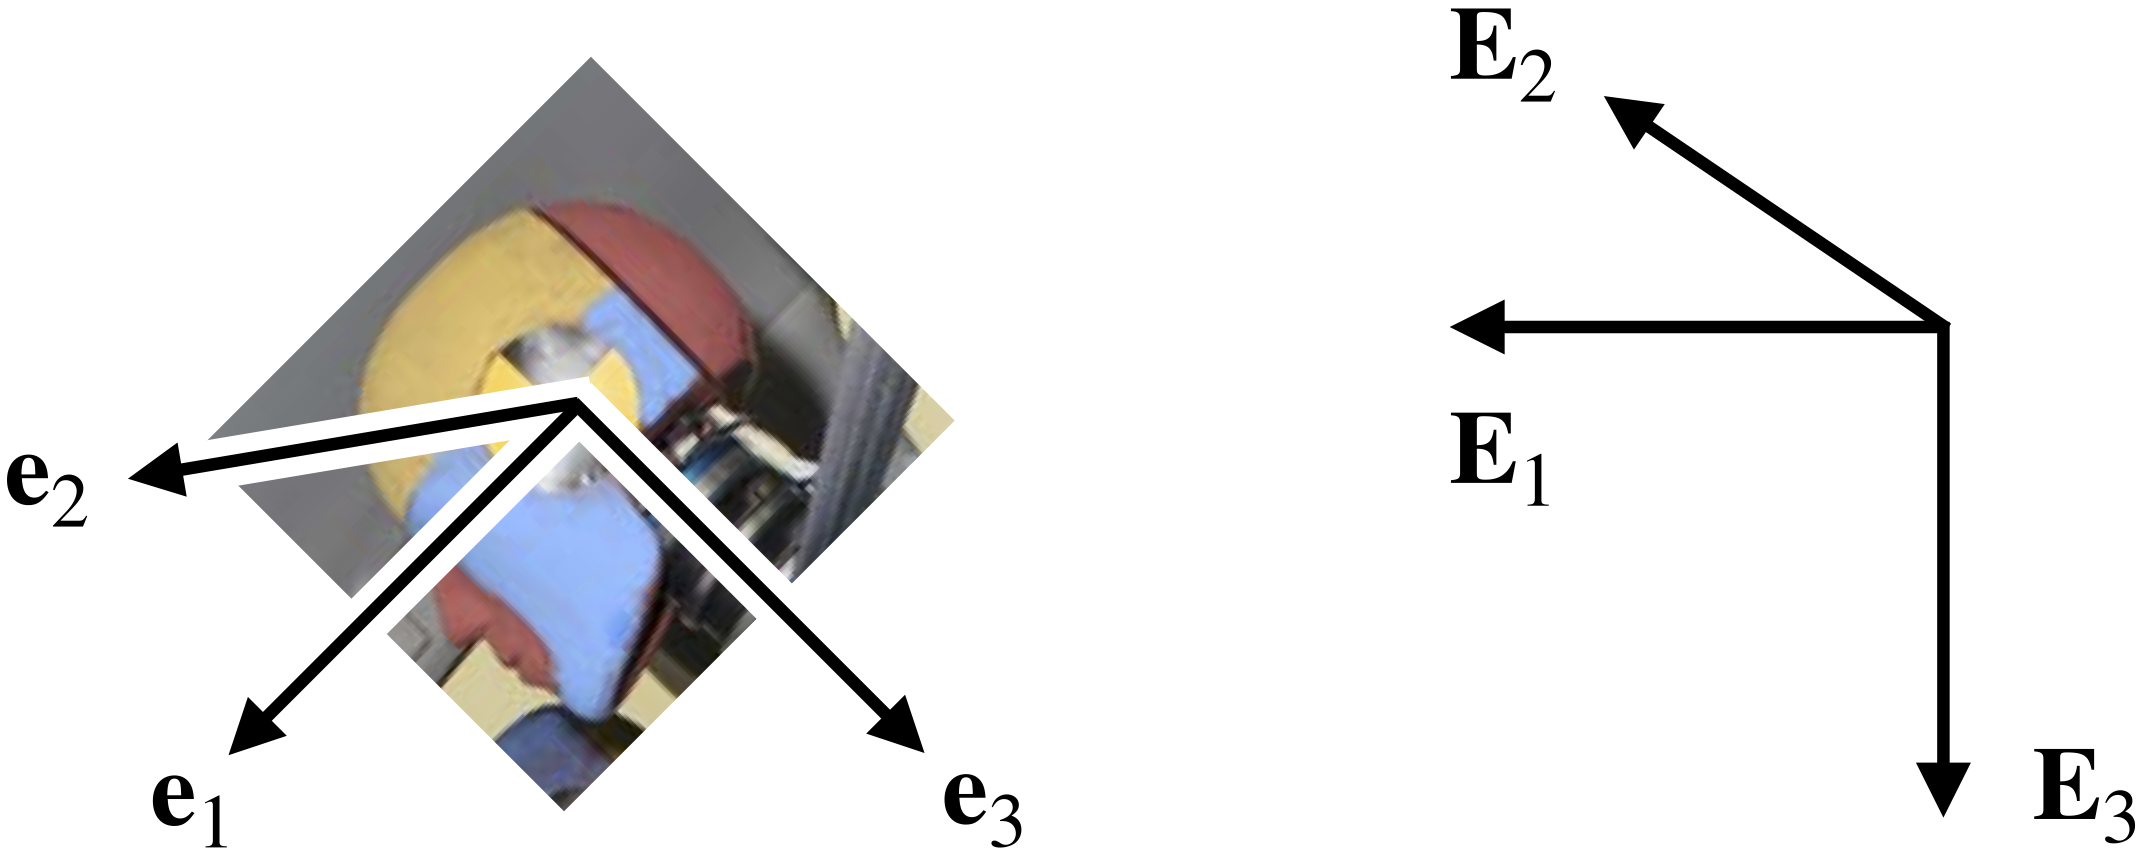
 . The source photograph is from NHTSA’s final report for a 35-mph frontal barrier impact test of a 2016 Honda CR-V (NHTSA test no. 9492, photograph no. 034), which is freely available for download from here.
For a 3-2-1 set of Euler angles, the basis vectors and are related via the matrix-vector expression
(1) ![\begin{equation*} \left[ \begin{array}{c c c} \mathbf{e}_{1} \\ \mathbf{e}_{2} \\ \mathbf{e}_{3} \end{array} \right] = \left[ \begin{array}{c c c } 1 & 0 & 0 \\ 0 & \cos(\phi) & \sin(\phi) \\ 0 & - \sin(\phi) & \cos(\phi) \end{array} \right] \left[ \begin{array}{c c c } \cos(\theta) & 0 & -\sin(\theta) \\ 0 & 1 & 0 \\ \sin(\theta) & 0 & \cos(\theta) \end{array} \right] \left[ \begin{array}{c c c } \cos(\psi) & \sin(\psi) & 0 \\ - \sin(\psi) & \cos(\psi) & 0 \\ 0 & 0 & 1 \end{array} \right] \left[ \begin{array}{c c c} \mathbf{E}_{1} \\ \mathbf{E}_{2} \\ \mathbf{E}_{3} \end{array} \right] . \hspace{1in} \scalebox{0.001}{\textrm{\textcolor{white}{.}}} \end{equation*}](https://rotations.berkeley.edu/wp-content/ql-cache/quicklatex.com-18f91be61ed0f2f3265e2e875f80bacb_l3.png "Rendered by QuickLaTeX.com")
Consequently, the corotational components of angular velocity,  , may be written in terms of the Euler angles , , and and their rates of change as
(2) 
Thus, provided crash test data for  from the inertial measurement unit installed at the mass center of the dummy’s head, we may determine the head orientation over the duration of the crash by numerically integrating the system (2) of first-order differential equations. It is convenient to express these equations in the matrix-vector form
  for numerical integration in MATLAB, where the state vector
 ![\mathsf{y} = \left [ \psi, \ \theta, \ \phi \right ]^{T}](https://rotations.berkeley.edu/wp-content/ql-cache/quicklatex.com-80742e4d29d2967a2a7205cada3ee91f_l3.png "Rendered by QuickLaTeX.com") :
:
(3) ![\begin{eqnarray*} && \mathsf{M}(t, \, \mathsf{y}) = \left[ \begin{array}{c c c} -\sin(\theta) & 0 & 1 \\ \cos(\theta) \sin(\phi) & \cos(\phi) & 0 \\ \cos(\theta) \cos(\phi) & -\sin(\phi) & 0 \end{array} \right], \\ \\ \\ && \mathsf{f}(t, \, \mathsf{y}) = \left[ \begin{array}{c} \omega_{1}(t) \\ \omega_{2}(t) \\ \omega_{3}(t) \end{array} \right]. \end{eqnarray*}](https://rotations.berkeley.edu/wp-content/ql-cache/quicklatex.com-598eff96b50af0b63bde89c6964d39db_l3.png "Rendered by QuickLaTeX.com")
Now, suppose we locate the head’s center of mass using a set of Cartesian coordinates,  , and therefore the acceleration of the head’s mass center has the equivalent representations
(4) ![\begin{eqnarray*} \ddot{\overline{\mathbf{x}}} \!\!\!\!\! & = & \!\!\!\!\! \ddot{x}_{1} \mathbf{E}_{1} + \ddot{x}_{2} \mathbf{E}_{2} + \ddot{x}_{3} \mathbf{E}_{3} \\[0.05in] & = & \!\!\!\!\! a_{1} \mathbf{e}_{1} + a_{2} \mathbf{e}_{2} + a_{3} \mathbf{e}_{3} , \end{eqnarray*}](https://rotations.berkeley.edu/wp-content/ql-cache/quicklatex.com-4f6be79dc6bab12b23f5406fcd3a116b_l3.png "Rendered by QuickLaTeX.com")
where  are the corotational components of absolute acceleration obtained from the specific force data recorded by the head’s inertial measurement unit. Having already computed the head’s orientation over time, we next utilize transformation (1) and crash test data for
  to evaluate the space-fixed components of absolute acceleration,
  , that are then numerically integrated twice to determine the displacement components of the head’s center of mass:
(5) 
Simulation and animation
The initial state of the head is such that the head is facing directly forward while traveling at 35 mph in that direction:  ,
,  mph, and
  . For convenience, but without loss of generality, we assume the motion of the head’s mass center begins at the origin:
  . Using data collected during a 35-mph frontal barrier impact test of a 2016 Honda CR-V, the simulated absolute motion of the driver dummy’s head is animated in Figure 3.
Figure 3. Animation of the simulated absolute dummy head motion during a crash test. The animated behavior occurred over a span of 350 ms. The acceleration and angular velocity data used for simulation are for the driver dummy in a 35-mph frontal barrier impact test of a 2016 Honda CR-V (NHTSA test no. 9492). The raw data from this crash test are freely available for download from here.
Visually, the simulated head motion well approximates the observed behavior captured in the high-speed footage shown in Figure 4.
Figure 4. High-speed footage of a 2016 Honda CR-V undergoing a 35-mph frontal barrier impact test (NHTSA test no. 9492), with a close-up of the driver dummy. The source video, which is freely available through NHTSA, may be downloaded from here.
We may also approximate the motion of the head relative to the vehicle using acceleration data collected at, say, the rear left of the vehicle’s floor pan. The simulated relative motion of the dummy’s head is animated in Figure 5.
Based on the dummy’s response captured in the onboard high-speed footage in Figure 6, the simulated relative head motion is a good approximation of the head’s actual motion relative to the vehicle.
Figure 6. Onboard high-speed footage of the driver dummy in a 2016 Honda CR-V undergoing a 35-mph frontal barrier impact test (NHTSA test no. 9492). The source video, which is freely available through NHTSA, may be downloaded from here.
Downloads
The animation in Figure 3 was generated using the following MATLAB code:
References
- SAE International Surface Vehicle Information Report, Sign Convention for Vehicle Crash Testing, SAE standard J1733, rev. Nov. 2007. The original Dec. 1994 version is freely available to the public and can be found here.